
v2.png)
Peter Drucker is often quoted as having said “What gets measured gets done”. Four hundred years earlier, the Austrian mathematician, Georg Joachim Rheticus, made the observation that if you can measure it, you can manage it.
Ever since, having a good set of metrics to assess performance and manage improvement has been considered an essential business practice. Metrics drive behaviour, behaviour drives performance and performance drives outcomes.
Wrong metrics – drive wrong outcomes
The problem is, if you choose the wrong metrics, it will often drive the wrong behaviour, and you’ll achieve the wrong outcomes.
For example, in the absence of good customer experience metrics, many local councils use their Request for Service (RFS) systems to monitor the time taken to “close out” service requests compared to a target “service level”. Exception reports are generated and overdue requests are listed and expedited. All good practice, but it’s also far too common for requests to be closed prematurely before they are fully actioned, so departments, individuals and sub-contractors can escape the scrutiny of the much-feared “overdue RFS report”. When customers are later surveyed they reveal that many requests remain unactioned.
Hence even a good metric, used badly (or in isolation), often drives the wrong behaviour and results in poor outcomes.
Metrics that matter – drive continuous improvement
Our work with local government has revealed three key metrics that, applied to local councils’ “request for service” processes, can differentiate council performance and quantify the potential for saving costs and improving council and public outcomes.
The three key metrics are:
- Average number of contacts (interaction efficiency metric)
- Customer perceived completion (process effectiveness metric)
- Customer Satisfaction Index (customer outcomes metric)
Average number of contacts (interaction efficiency metric)
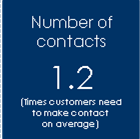 The first key metric has a direct impact on council resources and the
cost of managing and responding to customer requests for service. It’s a
measure of the number of times customers need to make contact with the
council before the request is actioned.
The first key metric has a direct impact on council resources and the
cost of managing and responding to customer requests for service. It’s a
measure of the number of times customers need to make contact with the
council before the request is actioned.
If customers need to contact the council more than once to have a request actioned, it has a costly impact on council efficiency, and a negative impact on customer satisfaction and community advocacy and support.
For example, if the average number of contacts for a council is 1.2, this indicates at least a 20% additional burden on its contact centre and customer interaction processes, and many additional costs and distractions resulting from calls escalating through the council to other departments, managers and elected representatives.
Customer perceived completion (process effectiveness metric)
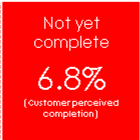 Expressed as a percentage of closed cases, this key metric tracks
where customers believe that the response and actions promised by the
council, have not yet been completed.
Expressed as a percentage of closed cases, this key metric tracks
where customers believe that the response and actions promised by the
council, have not yet been completed.
Customer surveys are conducted shortly after each case has been closed, to ensure that the requested service has been completed before the customer is asked for their feedback.
Customer Satisfaction Index (customer outcomes metric)
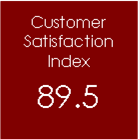 The Customer Satisfaction Index (CSI) is the principal top-level
metric summarising the customer experience outcomes from the RFS
process.
The Customer Satisfaction Index (CSI) is the principal top-level
metric summarising the customer experience outcomes from the RFS
process.
The CSI is calculated from the aggregated index of three specific performance outcomes:
- Customer satisfaction making the request
- Customer satisfaction with the action taken by the council
- Customer advocacy for the request for service process
Customer advocacy is measured in terms of the likelihood they would recommend a friend or neighbour contact the council for assistance if they experience a similar problem or concern.
Poor scores in these three key metrics often indicate:
- Customer expectations are not being correctly set
- Customers not being kept informed of progress
- Poor case management practices and weak response processes
Turning metrics into management actions
When you further disaggregate these scores and examine the performance of each department, request type and individual, it can reveal a multitude of “customer experience champions” and “service saboteurs”.
Councils that combine these three key performance metrics with a diagnostic approach to measuring and managing customer experience can obtain incremental and measurable improvements in their interaction efficiency, process effectiveness and customer and council outcomes.
This diagnostic approach requires two important elements:
- Performance must be measured along the customer’s journey (from making their request, to the response and actions taken by the council)
- Performance must be measured at the level at which you will need to take remedial action (i.e. measurement of each; request channel, request type, receiving officer, actioning office, and sub-contractor)
 Paul Linnell is a customer experience and service quality
improvement champion, working internationally with senior managers
and their teams to help them achieve business success, reduce risk
and build customer loyalty and advocacy by taking actions to improve
customer experiences. Paul specialises in the design and deployment
of customer experience measurement, service quality improvement,
complaints handling and preventive analysis programmes. Industries
he has worked with include, Automotive, Consumer electronics,
Consumer goods, Electricity & Gas retail, Financial services,
Information technology, Local Government and Public Sector, Media /
Publishing, Passenger travel (Rail, Air and Sea), Pharmaceuticals
and Telecommunication. Paul has worked with clients and presented on
these subject at conferences and corporate events in the UK, Europe,
North America, the Middle East, Australia and New Zealand.
Originally from the UK and now based in New Zealand, he continues to
serve clients globally.
Paul Linnell is a customer experience and service quality
improvement champion, working internationally with senior managers
and their teams to help them achieve business success, reduce risk
and build customer loyalty and advocacy by taking actions to improve
customer experiences. Paul specialises in the design and deployment
of customer experience measurement, service quality improvement,
complaints handling and preventive analysis programmes. Industries
he has worked with include, Automotive, Consumer electronics,
Consumer goods, Electricity & Gas retail, Financial services,
Information technology, Local Government and Public Sector, Media /
Publishing, Passenger travel (Rail, Air and Sea), Pharmaceuticals
and Telecommunication. Paul has worked with clients and presented on
these subject at conferences and corporate events in the UK, Europe,
North America, the Middle East, Australia and New Zealand.
Originally from the UK and now based in New Zealand, he continues to
serve clients globally.